Plot Comparison Page
Latitude vs. _________
Plots were created with data of 500+ cities across the world of varying distance from the equator.
Analysis and observations of each plot can be further explored on each plots individual page (see dropdown menu above).
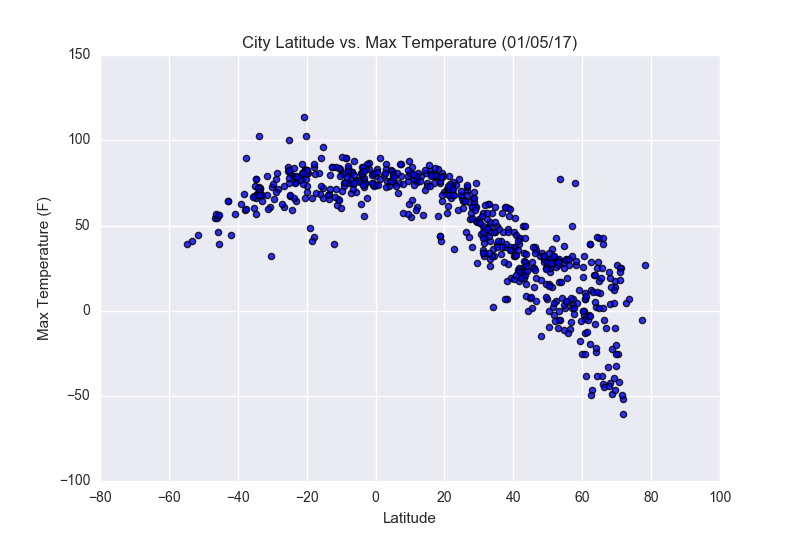
vs. Max Temperature
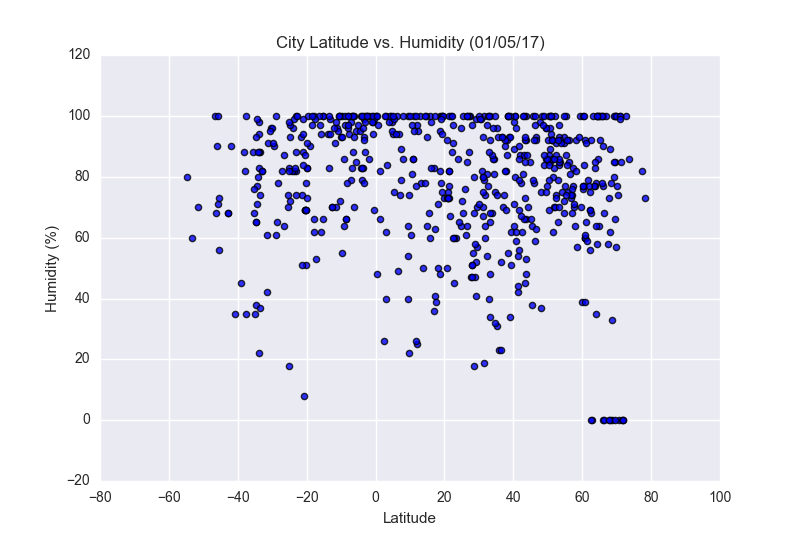
vs. Humidity
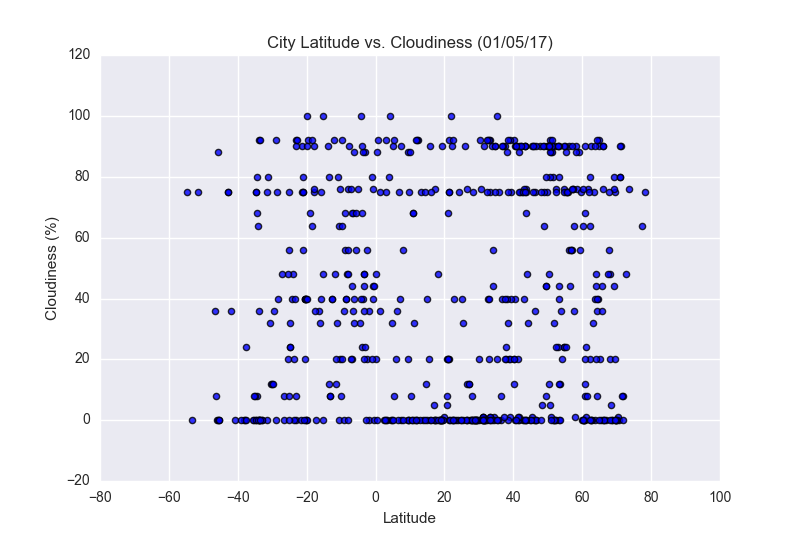
vs. Cloudiness
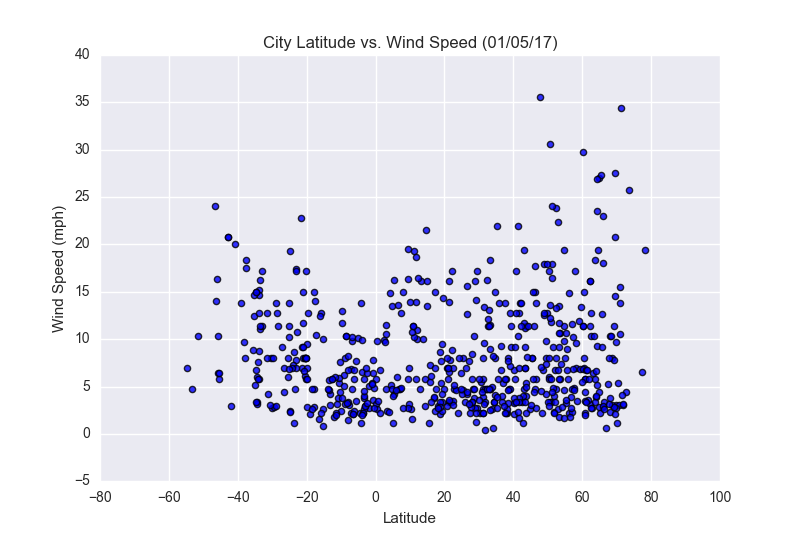
vs. Wind Speed